The United States National Weather Service operates a nationwide radar system known as NEXRAD. Raw data from NEXRAD is used by nearly all third-party websites or applications which provide any sort of weather radar information.
The Federal Aviation Administration operates its own radar system, known as TDWR, which provides higher-resolution data for certain major airports. TWDR data is shared with the NWS; however, it is not fully integrated into the NEXRAD data displays of most websites.
Since I live within the coverage area of the Boston TDWR, I wanted to view full resolution TDWR data layered with a high-resolution map layer. None of the free weather websites are capable of displaying TDWR data at its full resolution – so I implemented my own application, called Mr. Radar, for displaying radar data.
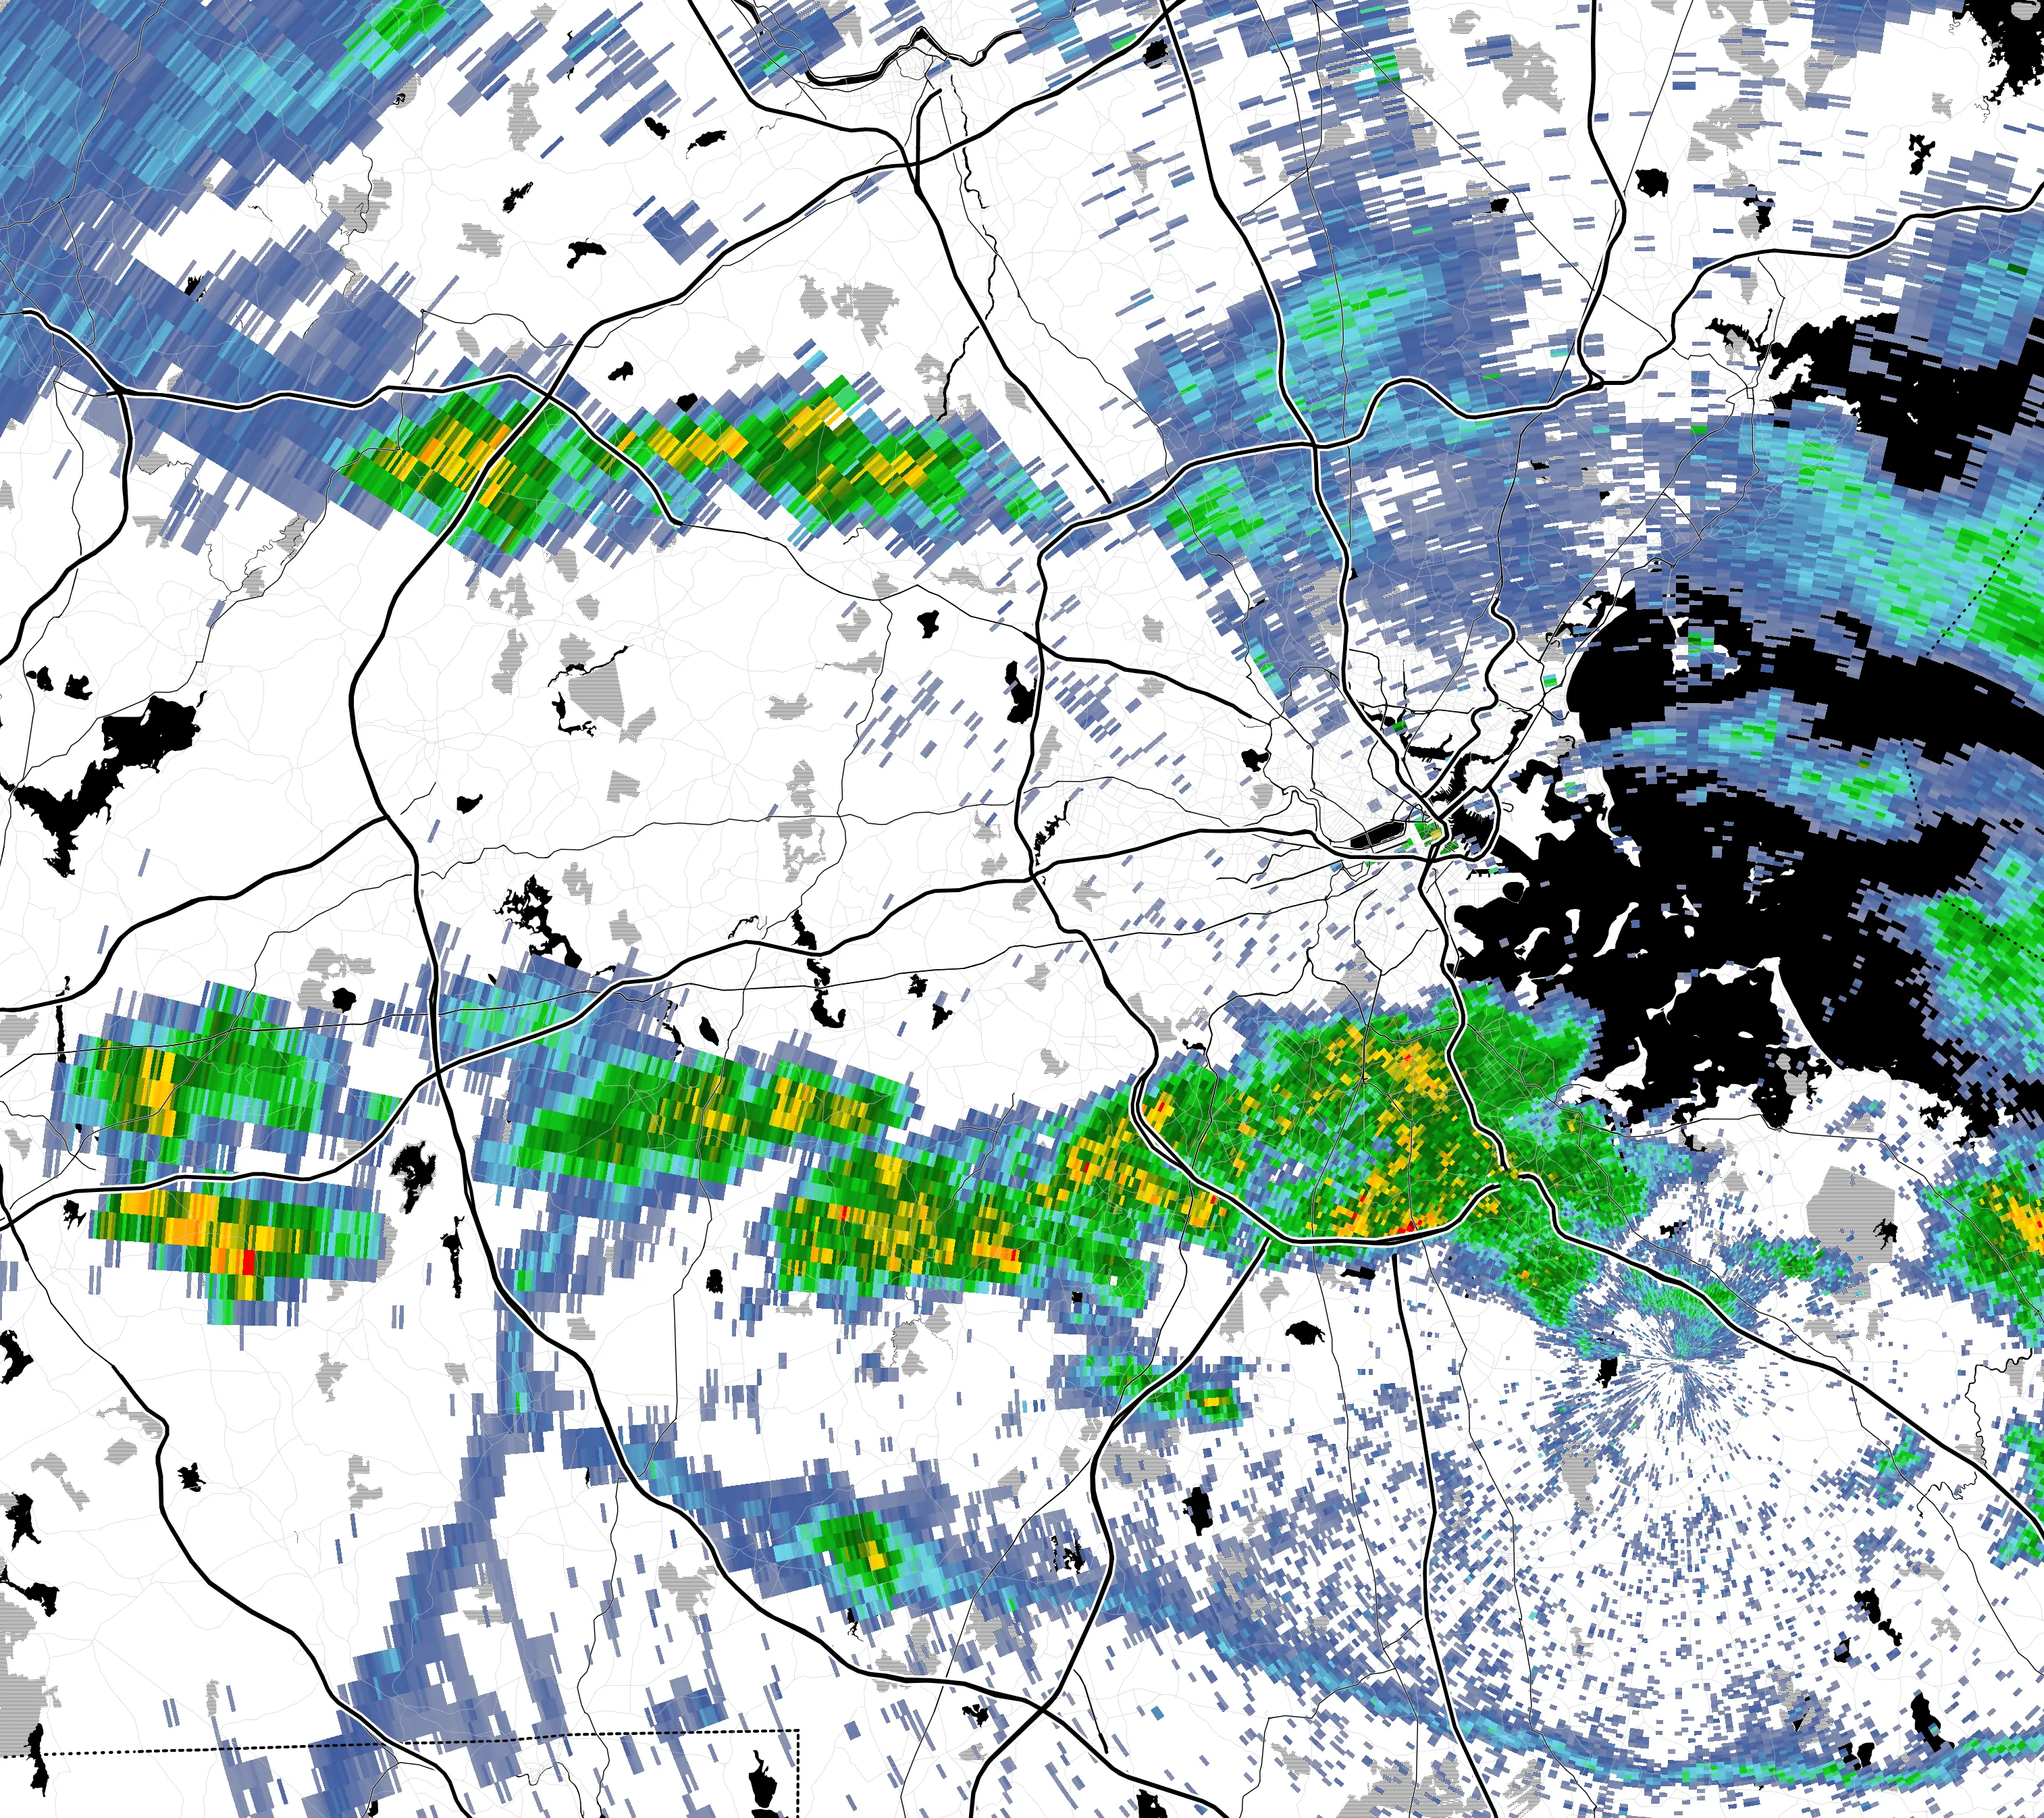
High-resolution output from Mr. Radar.
Although data from the National Weather Service is free for all, the necessary documentation can be hard to find, out of date, and difficult to understand. This page is a compilation of resources and information that I found helpful in the process of developing my radar viewer.
Obtaining the raw data
Raw radar files are downloaded from the NWS FTP server. A separate page documents the radar file paths. Each type of measurement made by the radar system is called a “product”. NWS publishes a list of radar products and provides detailed explanations of the various products for NEXRAD and TDWR. Notably, nearly all of these resources are out of date and do not include the changes to TDWR product codes which were implemented in late 2019.
Putting it all together, the URL for the most recent low-level base
reflectivity image from the Boston NEXRAD is
ftp://tgftp.nws.noaa.gov/SL.us008001/DF.of/DC.radar/DS.p19r0/SI.kbox/sn.last
and the URL for the most recent low-level base reflectivity image from
the Boston TDWR (higher resolution and shorter range than NEXRAD) is
ftp://tgftp.nws.noaa.gov/SL.us008001/DF.of/DC.radar/DS.180z0/SI.tbos/sn.last.
When in doubt, the full directory structure can be explored using the http
file browser.
File format and product definitions
NWS “Interface Control Documents” are the formal documents describing the content and protocol of the downloaded radar data files. The available Interface Control Documents are listed separately for NEXRAD and TDWR. The file format and product content are described in separate interface control documents:
| ICD type | NEXRAD | TDWR |
|---|---|---|
| File format | 2620001X | 2620063 |
| Product content | 2620003X | 26200xx |
The downloaded files don’t have a proper file extension. They contain Level III radar data and are commonly called “Level 3 files”.
Parsing and plotting
Opening Level 3 files
I use MetPy to open the Level 3 radar files which are downloaded from the FTP server. Its Level 3 file class is quite capable, although the documentation is primarily by example.
Geodetics and projections
The Level 3 file provides the latitude and longitude of the radar station, and the azimuth (angle) and distance (range) to each sample point. Most online map layers use a web Mercator projection to convert between latitude/longitude and planar coordinates. Getting the radar lined up with the map (without errors of a few meters) is actually quite a complex problem.
The conversion is most easily accomplished using the PROJ coordinate transformation software (via its pyproj Python wrapper). First, we convert azimuth and distance to latitude and longitude. This is known as a “forward geodetic” computation:
lon, lat, _ = pyproj.Geod(ellps='WGS84').fwd(ctr_lon, ctr_lat, azimuth, distance)
Second, we project the latitudes and longitudes to web Mercator coordinates (also known as EPSG 3857 coordinates):
x, y = pyproj.Proj(3857)(lon, lat)
The resulting coordinates have units of meters at the equator. To
convert to the dimensionless scale typically used by web maps, divide
all coordinates by 2 * pyproj.Proj(3857)(180, 0).
Rendering
In matplotlib, the most applicable function for drawing radar data is
pcolormesh.
Notably, the coordinates used by pcolormesh are the corners of each
radar pixel. If the shape of the radar data array is (m, n), the shapes of the
latitude, longitude, X, and Y arrays must be (m+1, n+1).
Since pcolormesh draws each pixel as an individual rectangle, the edges between pixels do not render cleanly when opacity is less than 1. This is a known issue that does not admit a simple solution. The best workaround is to render with opacity 1, and then alter the transparency of the rendered image (if desired).
The MetPy color tables are only partially documented. In particular, MetPy provides the list of colors, but doesn’t include the associated units or start and step values. The magic invocations are:
metpy.plots.colortables('NWSStormClearReflectivity', -20, 0.5)  # in dBZ
metpy.plots.colortables('NWS8bitVel',-100, 1.0)  # in m/s